 For years while Apple had proprietary system software, I was itching to get a Unix system underneath and have the ease of the windowing system. Well, after OsX was released, I was ecstatic. Why? Because of the ease of some tasks in Unix in comparison to other OS’s. This post is only one example of what you can do if you do a bit of research into how to use your Mac. For those who have un*x boxes, this will merely be a place-holder for a few AWK scripts for you.
Read More
Tag Archives: Software
Software For Scientists: Awk (& OsX)
More on XRD Q-space mapping.
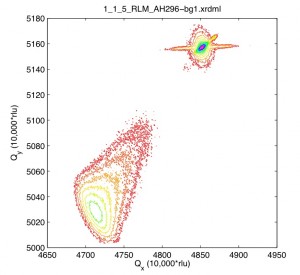
After some new scans, it appears the XRDMLread.m function I talked about is doing a pretty good job of getting the 2-axis scans into MATLAB. I was able to alter the code to accept the standard Epitaxy software’s translation to Q-space. (In Epitaxy the default is R = 0.5 I believe.) So, the following image was imported with XRDMLread.m the plotted with the standard 2-d example from the author’s website. The code was altered to output 10000xRLU units the same as Epitaxy (Panalytical). I haven’t checked all the numbers, but it’s looking ok so far. Unfortunately the color-scale looses it’s meaning as far as intensity is concerned, it appears at first glance.
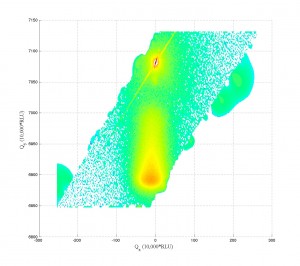
Working a bit with my old q-space map code, I’m able to accomplish the following:
Note the strange love-handles the data gains. I suspect this might be due to the Gridfit function (see MATLAB files repository) I used for regridding the data. Gridfit.m uses an extrapolant method. My suspicion is it is trying to fill out the square of the data matrix and is accomplishing relatively correct values for near-by-data that is outside the scanned range. I’ll try it again with regrid or something similar in the future when I have time.
If anyone knows where the current site for XRDMLread.m is, I’d love to link to it. It appears the site may be down (graduated student I suspect). You can obtain the wonderful XRDMLread.m function and examples on the XRDMLread.m website. For now, I have to wait until I hear from the authors before I can share the file. I also don’t yet trust my icky 3D code, so I prefer not to release that until I have things hashed out. Sorry!
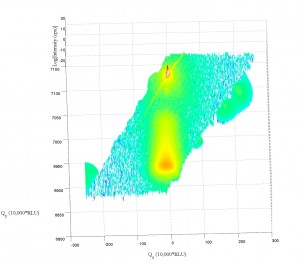
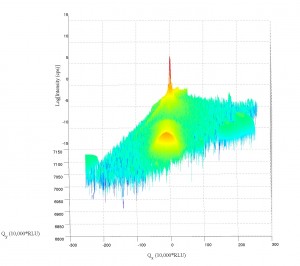
I’m extremely happy that Panalytical has published their XRDML file format and that the makers of XRDML.m have released their .m files for MATLAB. In the past, when Philips had the Xpert systems, the data was stuck for the most part in proprietary data formats. [You could slice the data and output in ascii- but making that work was a pain- which is why I never released that previous code.] I’m much closer to the 3d plotting now, and hope to finish it up before the thesis (my primary work which is not this plotting) is published.
Wishing you luck in you research!
Matlab doesn’t open two windows? – Here’s a fix.
After finally installing Leopard (10.5) osX on my Powerbook G4 (Thesis writing computer), I noticed a strange behavior with MATLAB. MATLAB could no longer open more than one instance of itself. As well, it could no longer open a window once it had opened once in any login session. Strange behavior indeed.
Well, here’s the fix… it turns out that Leopard uses launchd to set the display. So, the old method of launching MATLAB was to set the display to 0.0, but this will fail after the first instance, hence the bug. What you can do is simply remove this line from the startup script in matlab (located within the startup application contents).
The line that was:
$SHELL -c 'bin/'$ARCH'/setsid bin/matlab -desktop -display :0.0 &'
should now be:
$SHELL -c 'bin/'$ARCH'/setsid bin/matlab -desktop &'
Once I changed that, everything started up fine! ![]()
ps- you will know you have this problem if you look at your console log immediately after launching MATLAB and it says something like:
6/29/10 9:03:34 AM [0x0-0x78078].StartMATLAB[23469] Warning: Unable to open display :0.0, MATLAB is starting without a display.
Software For Scientists: Engauge Digitizer
In the time I’ve been doing my research work at the Univ. of IL, I’ve come across a number of graphs from various past researchers, older papers, stuck on the side of machines (calibration curves), and even hand-drawn or chart-recorder graphs in my numerous projects. The only major problem with those graphs I’ve found is that they aren’t in a digital form for further use with other data (instrument response functions) or to include in your own work as a reference. So, what to do?
Well, there’s an easy solution. It’s not the perfect solution, as it’s a bit slow, I’ll get to that in a second, but it’s a great solution to the problem, and has worked for me a number of times now. To top it off, it’s open-source, donation-ware, and cross-platform: Engauge Digitizer (see post at LifeHacker.com). Don’t let the website and lack of recent updates deter you. Tools that can do what Engauge does are few and far between. So, it is definitely worth a try. Here’s an example of how I’ve used it just the other day (prompting this post- I’ve used it for years now, but the recent use reminded me I should share it with others). [click "More" to see an example use and learn more]
Use GeekTool to show S.M.A.R.T. drive status on the desktop (osX)
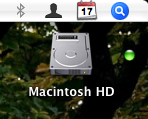 Well, recently I had a hard-drive corruption occur due to my use of TechTool (as shipped by Apple with their extended coverage- Apple, please ship DiskWarrior with your extended coverage!!!). Since then I’ve been worried about the health of my main os drive, and just learned about S.M.A.R.T. (which is supported by ATA/IDE drives in OsX).
The S.M.A.R.T. status for your drive can be checked in DiskUtil.app (where I’m not sure- couldn’t find it with a cursory check). You can also check it in the command line by typing the following (did you know Disk Util was available in the command line?)…
diskutil info /dev/disk0
Of course you may have to check which drive is the drive you hope to check the smart-status on, but disk0 is most likely your boot drive.
To get this as a visual reminder of your disk status, add the following code into GeekTool:
diskutil info disk0 | grep Verified > /dev/null
Then turn on GeekTool‘s Icon mode, which uses logical output from the commandline to select an icon to display on the desktop. I used the “default” icons (green or red dot). (This last step comes courtesy of beerguy in the comments area of MacOSXhints.com of this article.)
So, there you have it, a little icon on your desktop which can warn you of impending doom for your hard drive. [See the upper left corner of this blog post.] Very helpful for thesis writers. Of course, impending doom may be too late- so you better have a good backup solution in the works. Oh, and I suggest either adding a title for the icon (try another little mini geektool item) or placing it somewhere (where your drive usually resides) so that in the future you don’t have some odd green or red dot which has no meaning, but which you are sure must be important.
